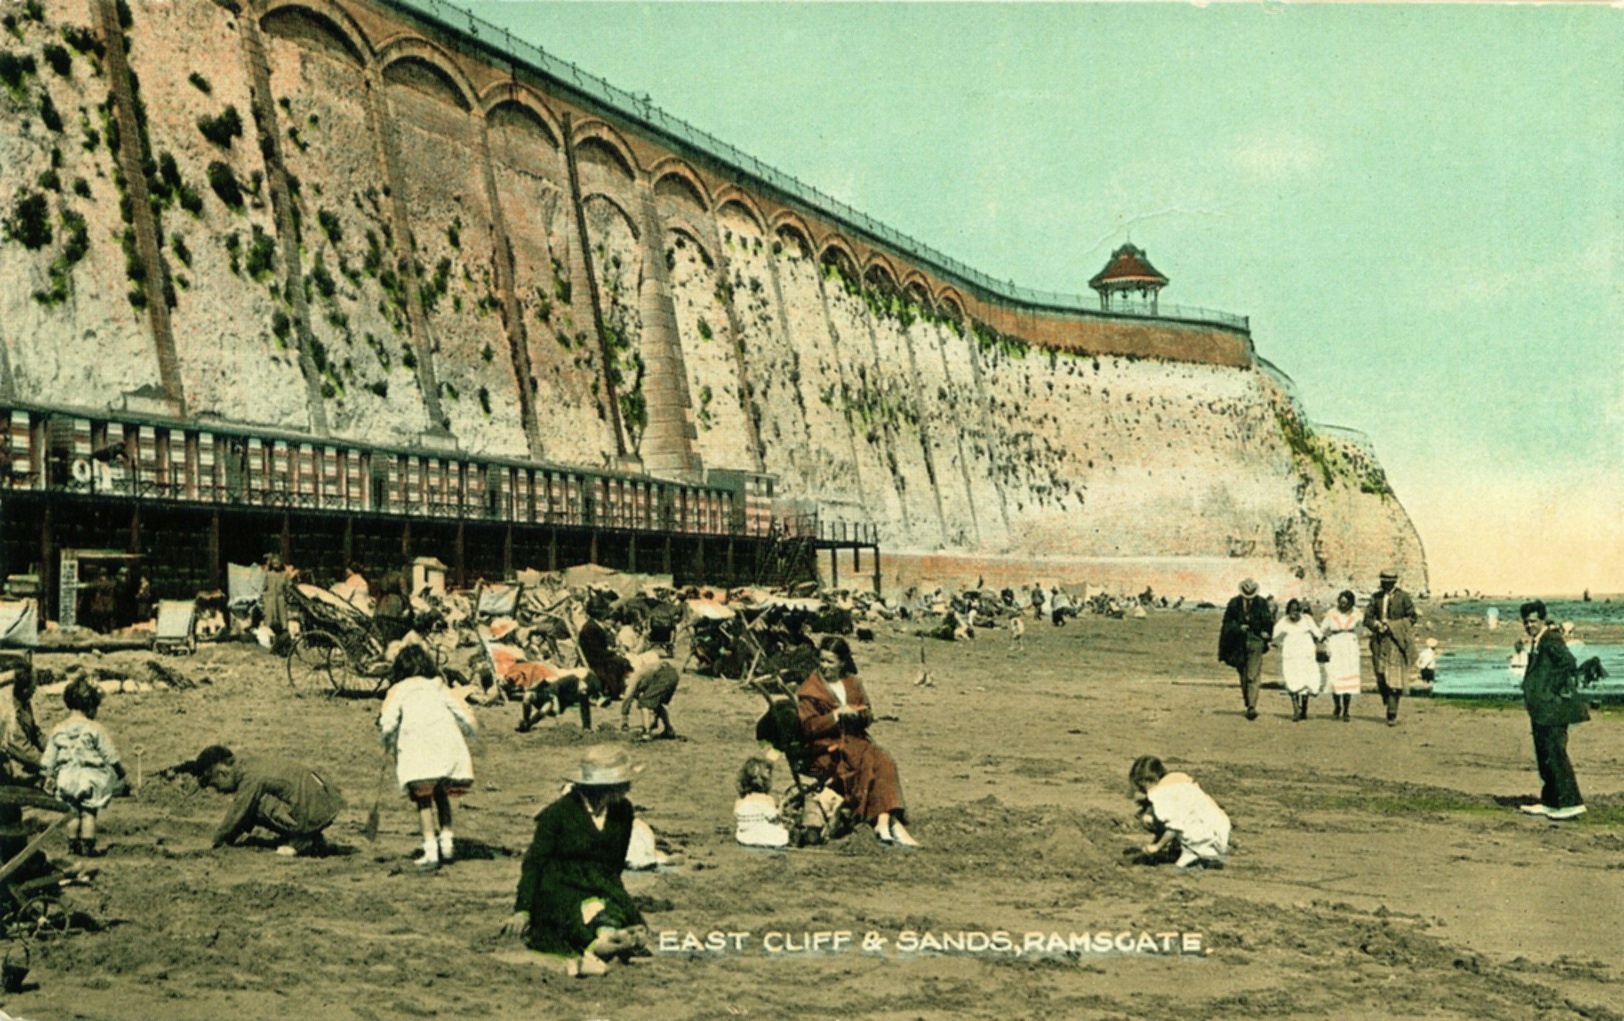
Starting with Ramsgate and warning people that I will put the Thanet coronavirus figures at the bottom of this post, so don't go right to the bottom if you are trying not to think about them.
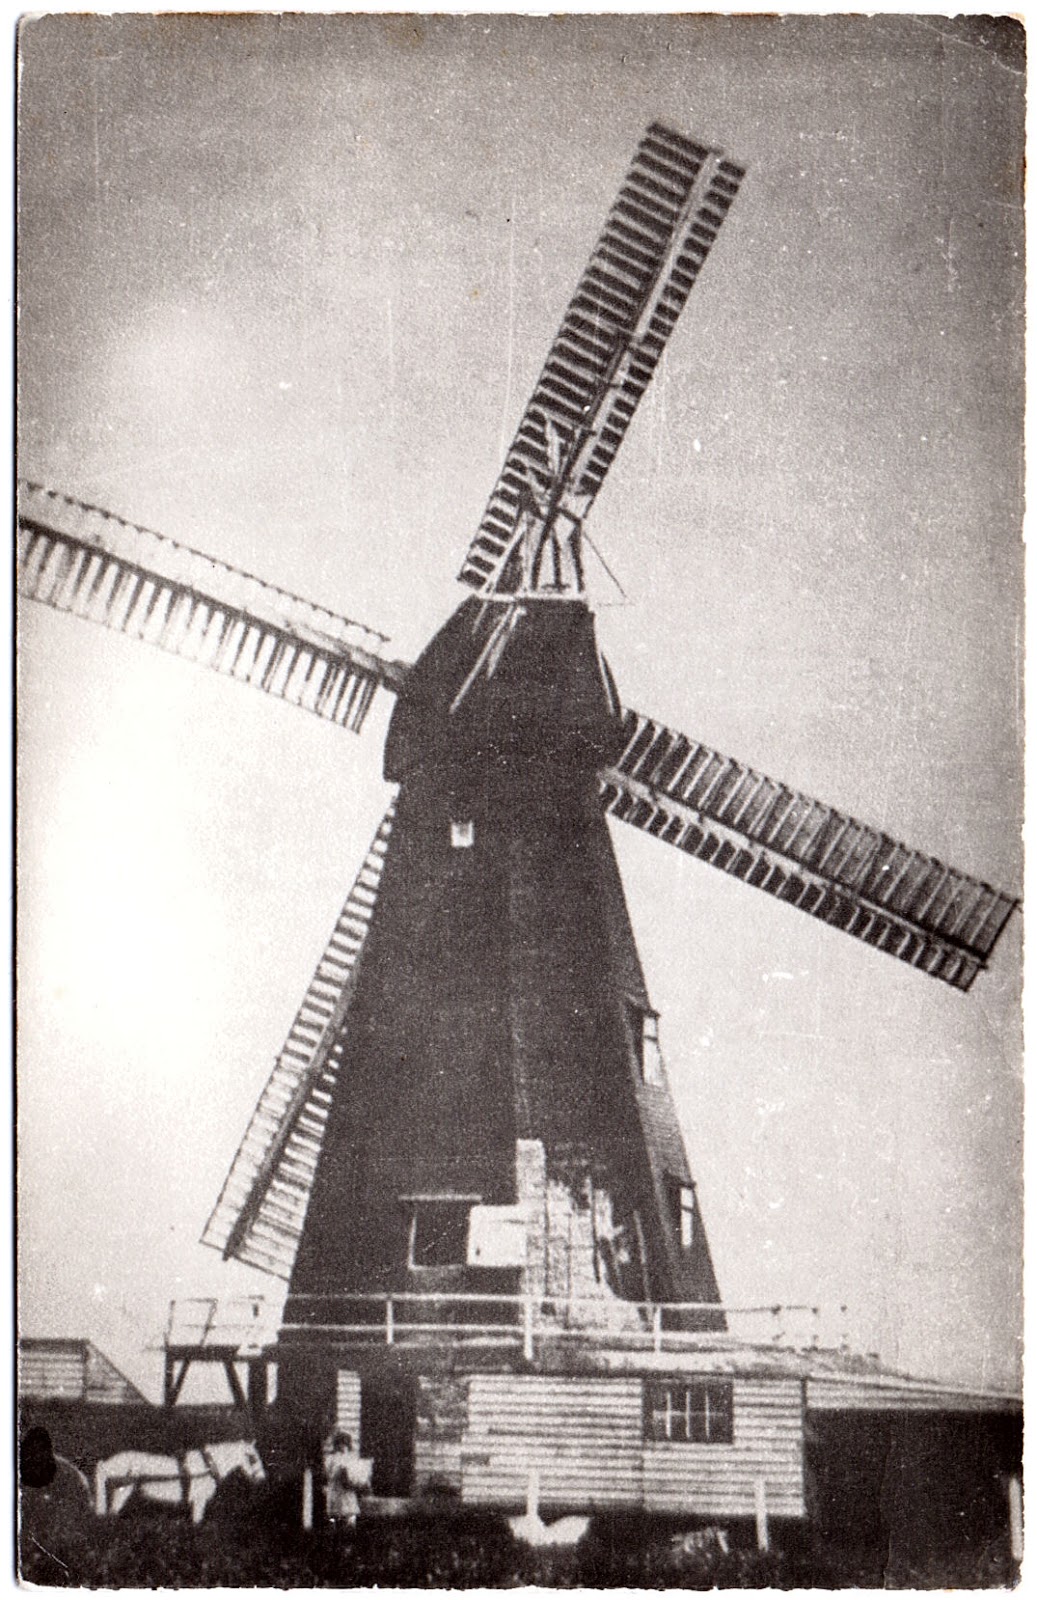
This first lot are Grange Road Mill
Looking on the 1822 Ramsgate map you can see there were once 3 mills where Grange Road is now
Hudson's Mill, the original Pugin designed shape
which as you can see from the photo was extended upwards and towards you to make a bigger one
Pegwell you can see the mill top left of the photo, this is the only photo of this mill I know of although it appears in several local prints
Broadstairs next
then on to Margate
Hoopers mill at Zion Place
Then to Sarre Mill, the photos I took some time ago have become a record of this mill which looks to be in a pretty bad way now, but is still just about standing.
On to the local coronavirus figures.
Because the Thanet infection rate figures went so high and about a week ago were the third worst in England I took an interest in our relative placing compared to the rest of the country and followed the number of cases publishing these figures to the main local Facebook groups that seemed to be interested in discussing local news.
I was surprised to find differences between the figures published by the county council, the district council, the local media to the figures published on the main UK Gov website.
I think to understand the severity of the current pandemic most people need something to compare with and relate to.
Deaths at 20th Dec 2020 rounded to the nearest
1,000 – covid on death certificate 80,000 – deaths recorded 2020 above the
normal annual death rate 81,000 – civilians killed in WW2 70,000, annual uk flue
deaths recorded for a winter figures usually published in June 10,000.
That said I think Thanet seems to be levelling out, hardly any change between yesterday and today with a slight fall yesterday, so I don't expect to carry on publishing the figures unless the is a radical change.
Here are today's comparative virus figure per week per 100,000 from the UK Gov website,
1 Thurrock 1,291.7
2 Havering 1,219.4
3 Epping Forest 1,174.7
4 Brentwood 1,133.5
5 Basildon 1,117.5
6 Redbridge 1,082.2
7 Medway 1,075.5
8 Rochford 1,059.9
9 Barking and Dagenham 994.8
10 Hastings 961.6
11 Southend-on-Sea 937.1
12 Swale 920.2
13 Ashford 915.2
14 Newport 894.1
15 Bexley 866.3
16 Waltham Forest 854.6
17 Castle Point 835.7
18 Tower Hamlets 818.5
19 Gravesham 814.5
20 Enfield 814.3
21 Dartford 804.6
22 Newham 794.3
23 Dover 791.5
24 Folkestone and Hythe 784.1
25 Maidstone 767.6
26 Harlow 736.2
27 Tonbridge and Malling 678
28 Chelmsford 669.9
29Braintree 665.8
30 Bromley 665.3
31 Haringey 659.6
32 Hackney and City of London 657.7
33 Milton Keynes 657.6
34 Canterbury 644.5
35 Thanet 642.6
36 Rother 633.8
37 Merton 613.9
38 Croydon 610.3
39 Greenwich 606.4
40 Wandsworth 602.4
Tuesdays comparative virus figure per week per 100,000 from the UK Gov website, Thanet and is still getting worse Canterbury slightly better, but hopefully the new tier 4 measures will be enough to turn the tide. Thanet District Council have published the right figure for three consecutive days now, which is as a positive sign, Kent County Council are still publishing different figures which seem to jump about all over the place. Some of the media doesn’t seem be consistent either or to publish comparative figures for the previous day. Plenty of room for error doing this and I’m not quite sure what happens if I make a mistake.
1 Thurrock 1,061.1
2 Havering 1,036
3 Basildon 1,002.1
4 Medway 991.5
5 Epping Forest 970.5
6 Swale 1,383
7 Redbridge 896.1
8 Brentwood 884.2
9 Rochford 872.2
10 Ashford 852.1
11 Barking and Dagenham 839.3
12 Hastings 805.1
13 Castle Point 791.1
14 Broxbourne 755.6
15 Dover 744.1
16 Bexley 739.5
17 Maidstone 728.1
18 Enfield 702.2
19 Southend-on-Sea 697.9
20 Waltham Forest 697.9
21 Gravesham 695.7
22 Newham 686.7
23 Dartford 674.9
24 Tower Hamlets 668.2
15 Folkestone and Hythe 666.4
26 Thanet 646.1
27 Tonbridge and Malling 628.1
28 Canterbury 619.7
29 Harlow 581.2
30 Rother 552.7
Wednesday's figures below
1 Thurrock 968.2
2 Medway 931.9
3 Basildon 931.1
4 Havering 925.4
5 Swale 879.5
6 Epping Forest 842.1
7 Ashford 806.7
8 Redbridge 793.5
9 Brentwood 788.1
10 Barking and Dagenham 760.9
11 Rochford 752
12 Hastings 732.8
13 Maidstone 709.4
14 Broxbourne 708.3
15 Dover 693.3
16 Enfield 651.9
17 Bexley 643.6
18 Gravesham 643.4
19 Waltham Forest 637.9
20 Canterbury 627.6
21 Thanet 619.4
22 Dartford 618.1
23 Folkestone and Hythe 606.2
24 Newham 605.2
25 Tonbridge and Malling 598.5
26 Southend-on-Sea 584.8
27 Tower Hamlets 584.2
28 Braintree 512.4
29 Rother 500.6
30 Chelmsford 486.6
I won't be replying to all of the comments individually. I am still working a lot of the time managing my staff remotely. So some general replies to the same sort of comments across the different local Facebook groups where I have been posting these figures. My reason for posting accurate and comparative figures derived from the UK Gov website, is mainly so people can see the direction the situation is going in and help to predict where we are likely to go next. In the UK the virus has already killed more people than the total number of UK civilians killed in WW2 (mostly the blitz) we are at war with coronavirus and I while feel the various conspiracy theorists, virus deniers, antivax idiots should be treated as unpatriotic, mostly live in other areas and are progressively making ordinary local people reluctant to comment, I just don’t have the time to reply to them. The vast majority of comments have been positive so I have posted again today.